Improved light attenuation
In my previous post, I talked about the attenuation curve for a spherical light source:
I had suggested applying a scale and bias to the result in order to limit a light’s influence, which is a serviceable solution, but far from ideal. Unfortunately, applying such a bias causes the gradient of the curve to become non-zero at limit of the light’s influence.
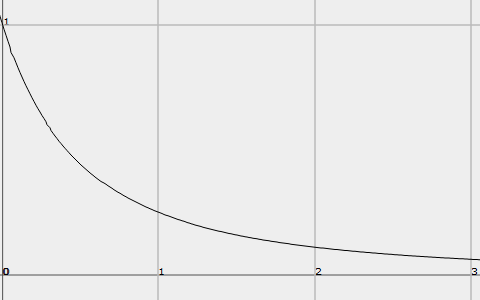
Here’s the attenuation curve for a light of radius 1.0:
And after applying a scale and bias (shown in red):
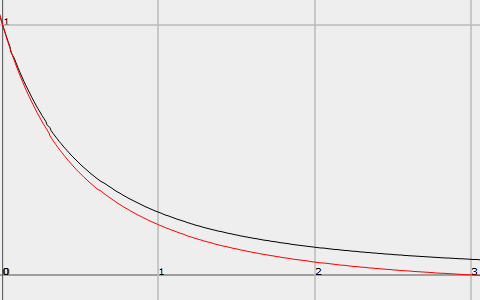
You can see that the gradient at the zero-crossing is close to, but not quite zero. This is problematic because the human eye is irritatingly sensitive to discontinuities in illumination gradients and we might easily end up with Mach bands.
I was discussing this problem with a colleague of mine, Jerome Scholler, and he came up with an excellent suggestion - to transform d in the attenuation equation by some function whose value tends to infinity as its input reaches our desired maximum distance of influence. My first thought was of using tan:
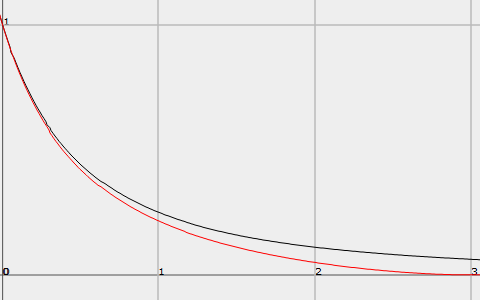
That worked well, the resulting curve has roughly the same shape as the original, while also having both a gradient and value of zero at the desired maximum distance. It does have the disadvantage of using a trig function, which isn’t so hot, so we went looking for something else. After a few minutes playing around we came up with the following rational function:
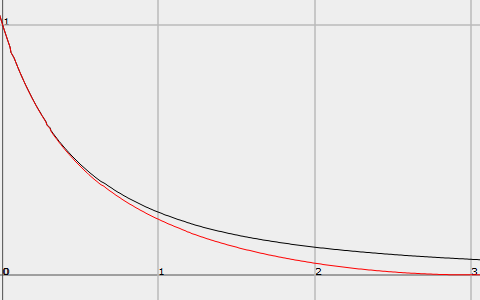
It’s very similar to the tan version, but may run faster, depending on your hardware.
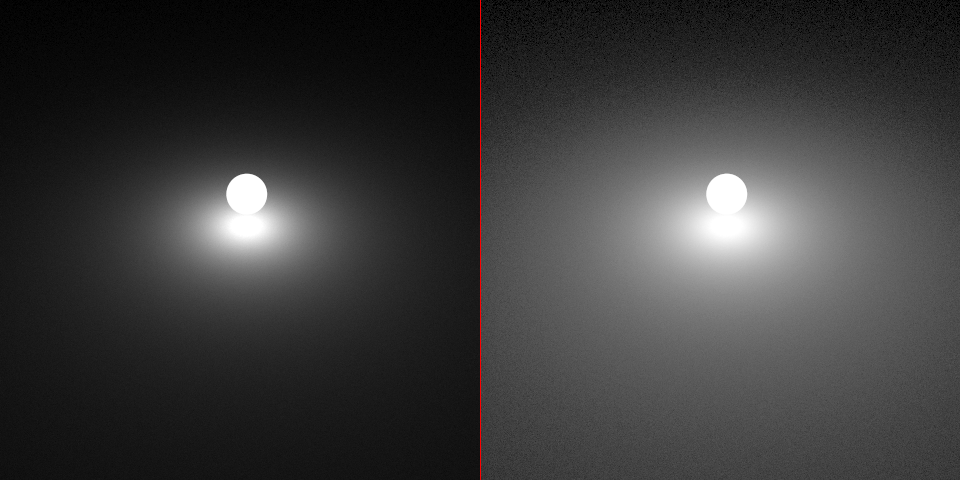
Below are some examples of the different methods, using a light with high intensity and small influence. On the left of each is the original image, on the right is the result of a levels adjustment, which emphasizes the tail of the attenuation curve.
Disclaimer: The parameters for the analytic functions were chosen to highlight their different characteristics, not to look good.
Original ray traced reference:
Analytic scale and bias:
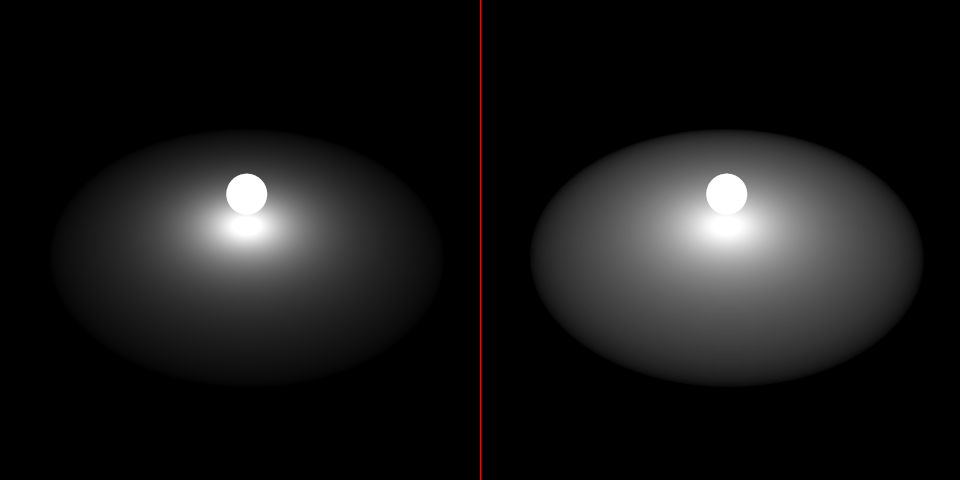
Analytic tan:

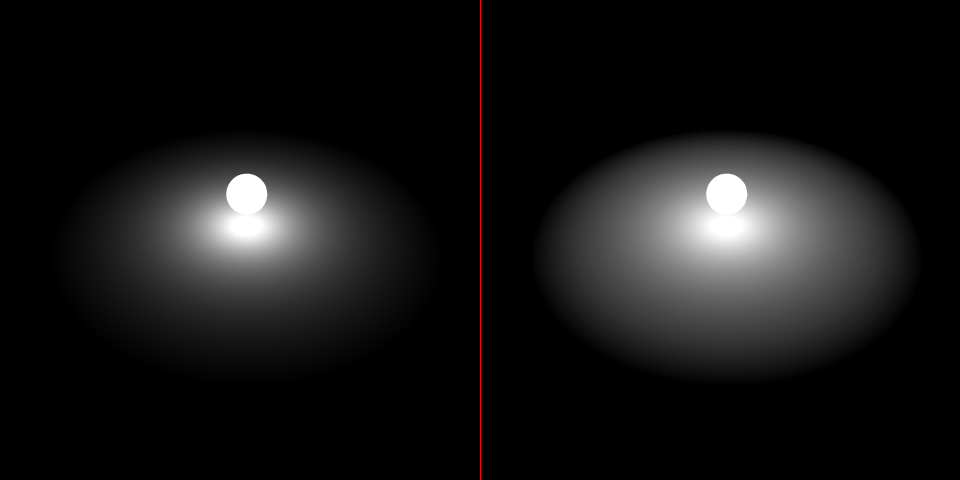
Analytic rational:
The graphs today were brought to you courtesy of the awesome fooplot.com.